


Table of Contents
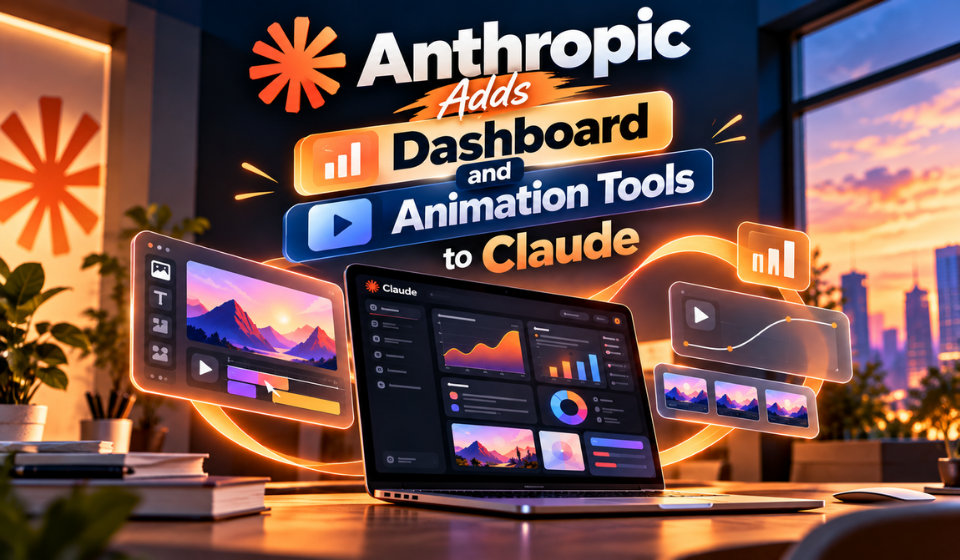
Anthropic is broadening the range of tasks users can complete with Claude. Its October 8, 2026 announcement introduced two capabilities: one for examining business information visually and another for producing animations. The company also expanded access to three existing content-creation tools.
The changes address a common workplace challenge: turning information into something people can understand and share. Data often needs to be summarised before a team can act on it, while presentations may require charts, diagrams or animated explanations.
Anthropic’s new tools are intended to help with parts of that process. Their availability differs by subscription, and users should check the company’s official announcement for the applicable requirements.
The introduction of Claude Dashboards gives users another way to explore business data and turn findings into visual reports.
From Business Questions to Visual Reports
Claude Dashboards is intended for people who need to investigate data without building every report from the beginning.
A user might want to compare sales across regions, examine changes in customer activity or review the performance of a particular business measure. Rather than manually assembling each visual element, the user can describe the question and use Claude to produce a dashboard based on supported information sources.
Anthropic lists connections to data platforms including Snowflake, BigQuery, Databricks, Amazon Redshift and ClickHouse. The company also identifies Salesforce among the services users can connect to.
Being able to inspect the query behind a result and see when data was last refreshed can help users understand what a chart represents. These details are particularly important when information changes frequently.
The tool can make initial investigations more accessible, but it does not remove the need to check the source information. Businesses should validate important calculations before using them to make decisions.
With Claude Dashboards, users can explore supported business information visually and review results before sharing them with colleagues.
An Alternative Way to Prepare Animations
Claude Motion addresses the production of visual material rather than data exploration itself.
Users can describe an animation they need, and the tool creates a sequence using elements such as text, images, charts and shapes. The result can be adjusted before being downloaded as an MP4 file.
This could be useful when a team wants to explain a product feature, illustrate a business trend or prepare material for employee training. Instead of constructing every movement manually, users can start with a generated version and refine it.
The editing capability is important because automated output may not match the intended message on the first attempt. Users should review the finished animation for incorrect information, awkward transitions and readability before sharing it.
Motion focuses on animating visual elements. It should not be described as a replacement for every video-production tool, particularly when a project requires filmed footage or specialised effects.
Access Is Different for Each Feature
Anthropic’s announcement covers five tools, but their availability is not identical.
| Tool | Availability announced |
| Claude Dashboards | Beta on paid plans |
| Claude Motion | Beta for Team and Enterprise customers |
| Claude Docs | Available on Free and paid plans |
| Claude Slides | Available on Free and paid plans |
| Claude Design | Available on Free and paid plans |
Docs, Slides and Design are now available across Claude’s subscription tiers, including the Free plan. Dashboards and Motion have more limited beta access.
This distinction matters for individuals and businesses deciding whether to use the new capabilities. A free subscriber may be able to use the expanded content tools without receiving access to both new features.
Organisations should also check their administrator settings, as Dashboards and Motion may need to be enabled before employees can use them. Because the two tools remain in beta, their functionality and access conditions may change.
Where These Capabilities Could Fit Into Daily Work
The two new tools serve different purposes, but they could be useful at different stages of the same task.
A business analyst could begin by examining a set of sales figures in Dashboards. After identifying a pattern worth sharing, a colleague could use Motion to create an animated explanation for a meeting or presentation.
A marketing team might use animations to explain a service, while an operations team could use visual reports to review performance. These are potential applications rather than guarantees that every workflow can be completed automatically.
The outcome will depend on the data available, the complexity of the request and the amount of human editing needed. Businesses should also consider confidentiality and ensure that connected accounts only expose information users are authorised to access.
For teams working with business data, Claude Dashboards could support early-stage analysis and help identify information worth presenting to others.
What Users Should Keep in Mind
These features provide additional ways to work with information, but users should evaluate them against their actual needs.
- Check whether the required data platform or service is supported.
- Verify figures and calculations before relying on generated reports.
- Review animations for factual errors and presentation problems.
- Confirm subscription eligibility before planning a workflow around either tool.
- Follow company policies when connecting accounts or using business data.
These checks can help users assess whether the tools save time without treating generated content as automatically accurate.
FAQs
What does Claude Dashboards help users do?
Claude Dashboards helps users create visual reports from supported data sources to investigate business questions and review trends.
What is Claude Motion designed for?
It creates editable animations using visual elements such as charts, text, images and shapes.
Can Free users access all five tools?
No. Docs, Slides and Design are available on the Free plan, but Dashboards and Motion have separate beta access requirements.
Are Dashboards and Motion fully released?
They were announced in beta. Their capabilities and availability may change as Anthropic develops them.
Should businesses replace their existing analytics software?
Not automatically. The tools may help with initial analysis and visual communication, but specialised systems can still be necessary for complex reporting, governance and production work.
How can Claude Dashboards help businesses?
Claude Dashboards helps users explore supported business data through visual reports, making it easier to examine trends and investigate business questions.
Conclusion
Anthropic’s latest Claude update gives users more options for reviewing information and preparing visual material. Claude Dashboards is designed to help people investigate business data, while Motion offers a way to create and refine animations.
The wider availability of Docs, Slides and Design also expands what free-plan users can access. However, subscription restrictions still apply to the two new capabilities.
For businesses, the most useful measure will be whether these tools fit existing processes, produce dependable results and reduce the work needed to communicate information. Their value should be assessed through practical use rather than assumed from the announcement alone.